In using Claude.ai to visualize different types of graphics and data, here are some artifacts that the tool has created in order to “map” the different parts that individuals can play.
Lansing Economic Growth Roadmap:
https://claude.ai/public/artifacts/d02a4e50-0cae-4ae0-ab80-d3c4a1308313
This is publicly shared.

Have you tried using AI? Here are some additional prompts and visualizations. You can use these as a starting point to understand and refine your own map.
Also, there is an excellent study released this week by the Lansing Regional Chamber of Commerce and the Lansing Economic Area Partnership that you can find here:
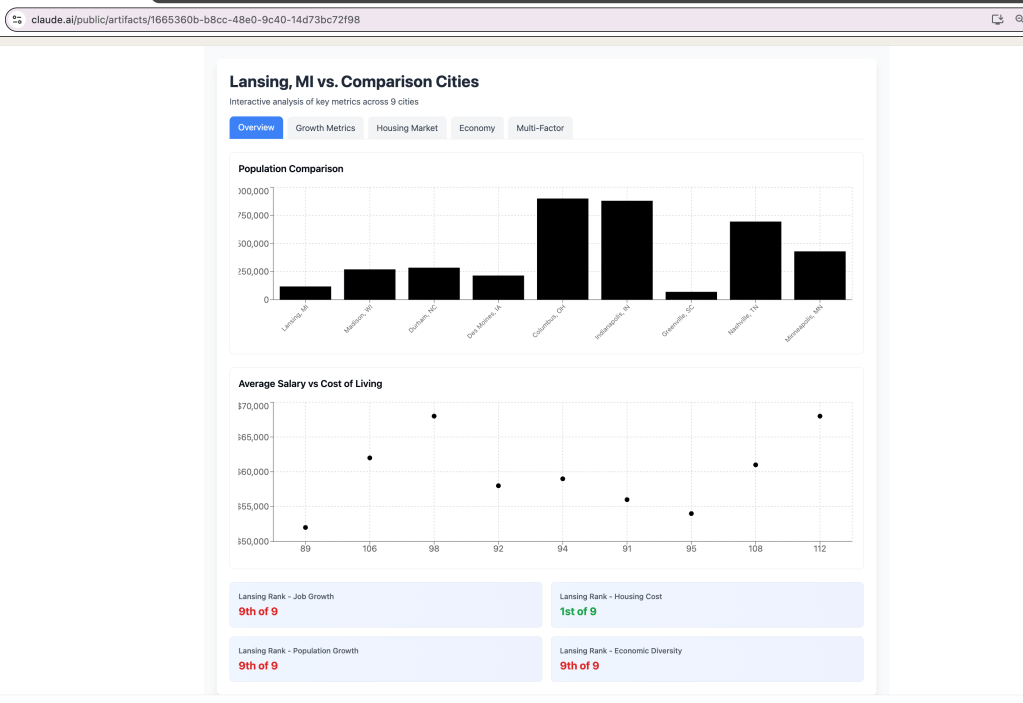
Finally, another comparison graph using Claude:
https://claude.ai/public/artifacts/1665360b-b8cc-48e0-9c40-14d73bc72f98